Features / Platform Level / Chime Reports
CHIME Reports
Chime provides regular reports of clinic utilization, which you can access at any time.
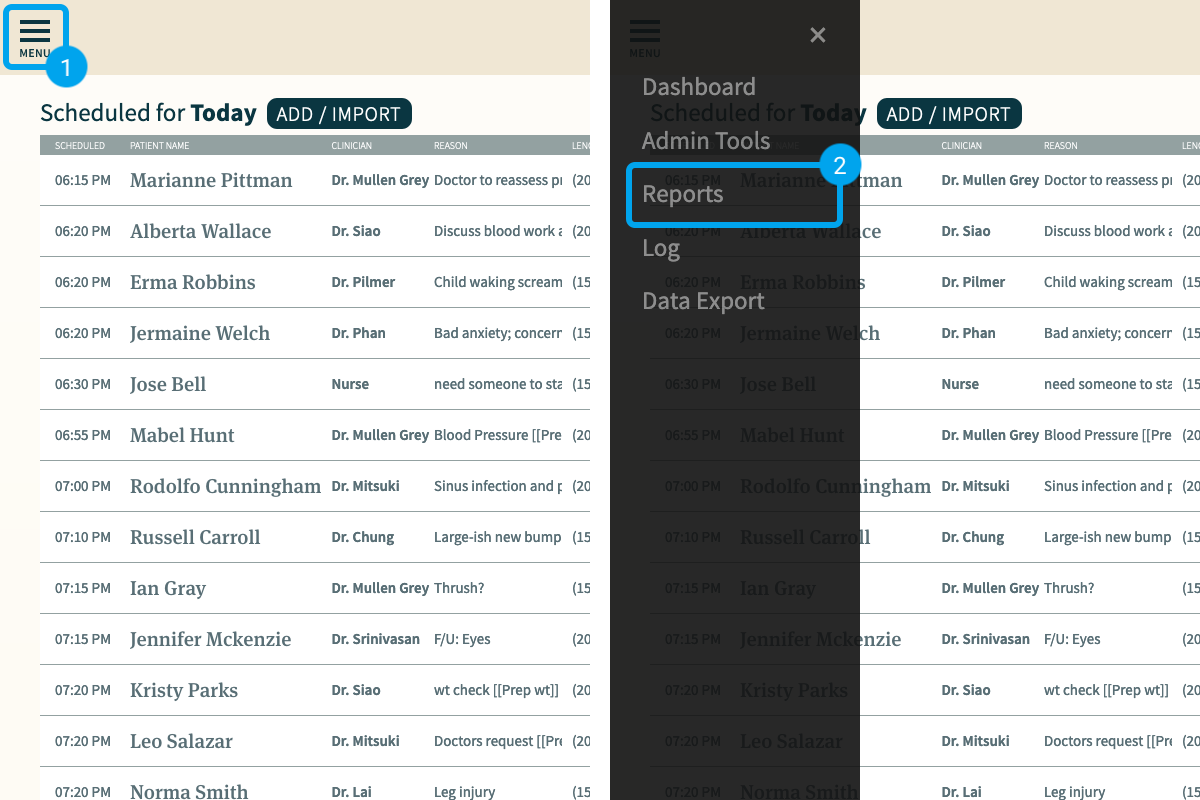
How to access reports:
Click on the ‘hamburger’ icon on the top left of CHIME
Select ‘Reports’
The report will then generate on the page you are redirected to
Note that generating reports will take a few minutes.
What’s included in the reports?
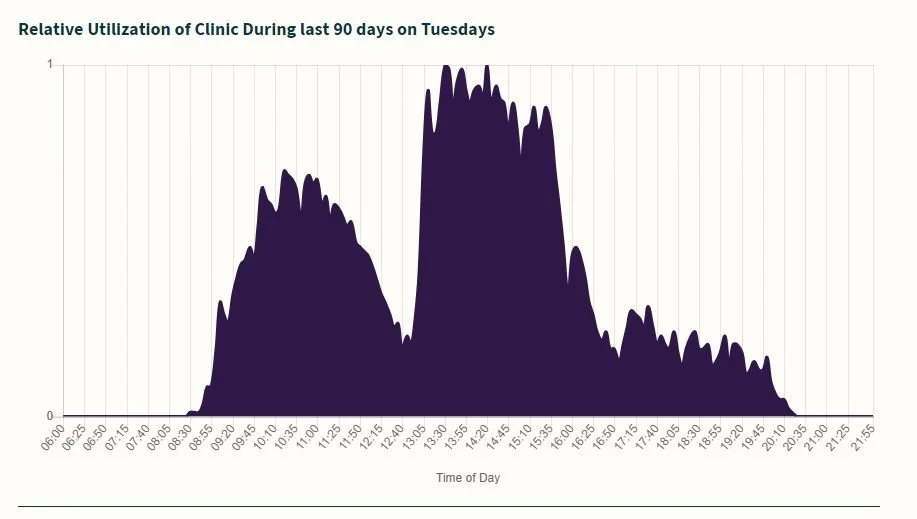
Line chart showing the relative utilization of the clinic on various days of the week, over the past 90 ninety days (1 is the absolute busiest the clinic gets)
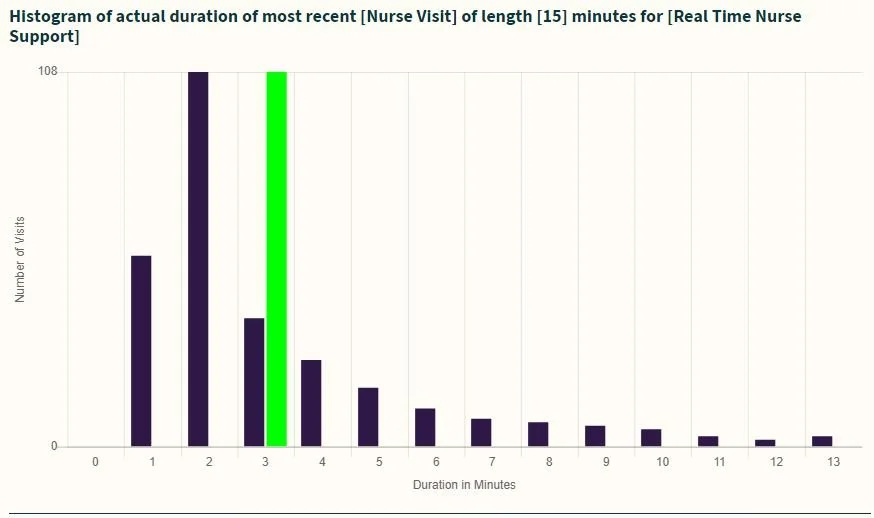
Histograms of appointment lengths for each clinician/each service type
Histograms of how long patients who arrived on time waited for each clinician/each service type


